How To Monitor CPU
How To Monitor CPU
Written by Nick Otter.
Contents
Introduction
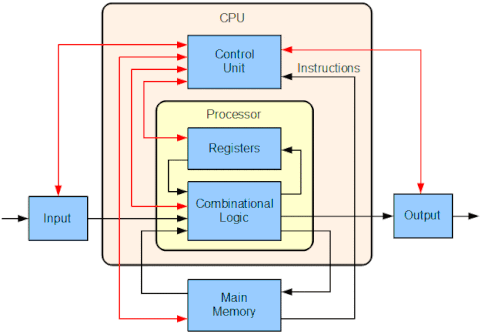
Ah… CPU. What’s the purpose of CPU in a system? Let’s see if we can find a diagram. This will do.

CPU is often referred to as the ‘brain’. Not a totally bad description. The CPU does not execute program instructions. It is more of a brain: sending messages to other parts of the body to take action.
Let’s look at some tools as to how we can monitor CPU on a Linux machine. Remember, as it’s a ‘brain’ we want to make sure it is directing other parts of the system as quickly as possible, and not being slow; telling an arm to wave 10 minutes after the queen has gone by.
Tools to monitor CPU:
| Action | uptime |
top |
glances |
/proc/loadavg |
/proc/cpuinfo |
iostat |
|---|---|---|---|---|---|---|
| See CPU load average. | ☑ | ☑ | ☑ | ☑ | ||
| See processes using CPU. | ☑ | ☑ | ||||
| See cores. | ☑ |
Ok, let’s get started.
Requirements
| Updated | 04/2020 |
| Linux | Kernel 5.4 RHEL 8 4.18 |
CPU load average
Let’s check out load average on a RHEL 8 box with uptime:
$ uptime
[root@rhel-8-1 ~]# uptime
 13:07:07 up 4 min,  1 user,  load average: 4.45, 1.61, 0.58
What does that output mean? Let’s take a look.
13:07:07 |
up 4 min |
1 user |
|---|---|---|
| Current time. | Length of time system has been running. | Number of logged on users. |
Fairly straight forward. But how about the numbers 4.45, 1.61 and 0.58? These are system load averages. The average number of processes that are using the CPU or waiting to use the CPU (and also uninterruptible processes - not covered in this article, but here’s a read more.
uptime shows CPU load averages for the last 1,5 and 15 minute periods.
4.45 |
1.61 |
0.58 |
|---|---|---|
Average number of processes that are using or waiting to use the CPU over the last 1 minute. |
Over the last 5 minutes. |
And over the last 15 minutes. |
Good and bad load averages
How to know what the appropriate load average is for system performance? This is entirely dependent on the amount of cpu cores.
The value of load average can be understood as threaded CPU-bound workloads.
If the load average is 0.0 the system is completely idle. If the load average is 1.0 there is (on average) one threaded CPU-bound workload or process for that period of time. If the load average is 2.0 there are two threaded CPU-bound workloads or processes for that period of time.
If your system only has 1 CPU core, but the load average is2.0 then there is one process using the CPU and one process waiting to use the CPU.
So, performance is dependent on cores. See the below chart for thresholds: :green_square: means all ok, :warning: means investigate, :sos: means critical. (Assuming all load average ranges are like that for > 1m).
load average |
1 core |
2 cores |
3 cores |
|---|---|---|---|
0.0 |
:green_square: | :green_square: | :green_square: |
0.7 - 1.0 |
:warning: | :green_square: | :green_square: |
1.7 - 2.0 |
:sos: | :warning: | :green_square: |
2.7 - 3.0 |
:sos: | :sos: | :warning: |
> 3.0 |
:sos: | :sos: | :sos: |
To see how many CPU cores your system has just run:
$ cat /proc/cpuinfo
To investigate and resolve higher than preferrable load average values (not including uninterruptible processes), process management tools like top and pscan be used and hanging processes should be killed gracefully.
Thanks. Linux Load Averages: Solving The Mystery, Understanding Linux Load Averages were useful to write this. This was written by Nick Otter.