How To Monitor UDP
How To Monitor UDP
Written by Nick Otter.
Contents
- Introduction
- Sniffing packets with tcpdump
- Understanding dropped packets
- UDP header values explained
- Checksum
- IPv4 header values explained
- Analyse UDP over time with wireshark
Introduction
If you manage a server that receives or transmits over UDP, how can this be monitored?
Using tcpdump and maybe some wireshark, let’s work it out.
UDP overview
UDP is a transport layer protocol and alternative to TCP. Like TCP it is carried in a single IP packet, but unlike TCP it does not require a handshake between sender and receiver, it is a connectionless protocol. The data is sent without requiring a response on receipt from the receiver.

So, loss tolerant services where data transmission loss is not considered critical will use UDP. Services where if not all data is received, it’s not required to resend that data again such as:
- Domain Name System (
DNS). - Streaming media applications such as movies.
- Online multiplayer games.
- Voice over IP (
VoIP). - Trivial File Transfer Protocol (
TFTP). - Network Management Protocol (
SNMP). - Routing Information Protocol (
RIP). - Dynamic Host Configuration Protocol (
DHCP).
(Yes I just pasted this list in, I hope it’s still helpful though.)
Okay, let’s begin.
Requirements
| Updated | 05/2020 |
| Linux | Kernel 5.4 RHEL 8 4.18 |
Overview of UDP tools
| Action | firewall-cmd |
netcat |
netstat |
nmap |
tcpdump |
wireshark |
|---|---|---|---|---|---|---|
| Open, close ports. | ☑ | |||||
Send UDP packets. |
☑ | |||||
List all UDP listening ports, port connections, listening programs. |
☑ | ☑ | ||||
| Sniff packets in console by port, host, hostname/IP. | ☑ | ☑ | ||||
| Analyse packet capture file dump. | ☑ |
Sniffing packets with tcpdump
Let’s look at some UDP packets. We’re going to use tcpdump to capture all UDP traffic on a port on an interface. Verbose mode (-v) is switched on to see some additional fields like checksum and ttl.
[root@rhel-8-1 ~]# tcpdump -i lo -n udp port 53 -vv
tcpdump: listening on lo, link-type EN10MB (Ethernet), capture size 262144 bytes
13:20:26.807498 IP (tos 0x0, ttl 64, id 35216, offset 0, flags [DF], proto UDP (17), length 32)
    127.0.0.1.59720 > 127.0.0.1.distinct: [udp sum ok] UDP, length 4
^C
1 packets captured
2 packets received by filter
0 packets dropped by kernel
Neat.
Let’s breakdown the output. What can we see? Let’s identify an IP and UDP packet from that output. IP encapsulates UDP, so when listening on a port for UDP you will get both the IP packet AND the UDP packet.
Here’s a breakdown of the separate packets shown in that output.
13:20:26.807498 IP (tos 0x0, ttl 64, id 35216, offset 0, flags [DF], proto UDP (17), length 32) |
| IPv4 header fields and values. |
127.0.0.1.59720 > 127.0.0.1.distinct: [udp sum ok] UDP, length 4 |
| UDP header fields and values. |
Understanding dropped packets
Before we move onto what the UDP header fields and values mean, let’s take a quick look at the line 0 packets dropped by the kernel in that tcpdump trace above.
0 packets dropped by kernel |
Number of packets dropped due to lack of buffer space (read droppped packets section for more. |
Packets get dropped due to no having enough buffer space in the kernel to capture them - why not increase buffer size (4069 is KB…):
$ tcpdump -B 4069
Or, pass the -c flag. This sets the number of packets captured. A low number here will now stop the buffer size from maxing out (20 means udp stream will stop after 20 packets have been captured…):
$ tcpdump -ni lo udp -c 20 port 53
Or, you can even save buffer space by stopping tcdump doing unneccessary DNS queries to resolve IPs by using the -n (no lookups) flag:
$ tcpdump -n port 53
Or, why not all three:
$ tcpdump -c 20 -n -B port 53
Nice.
UDP header values explained
Here’s a diagram of the UDP header structure (see also RFC 768).
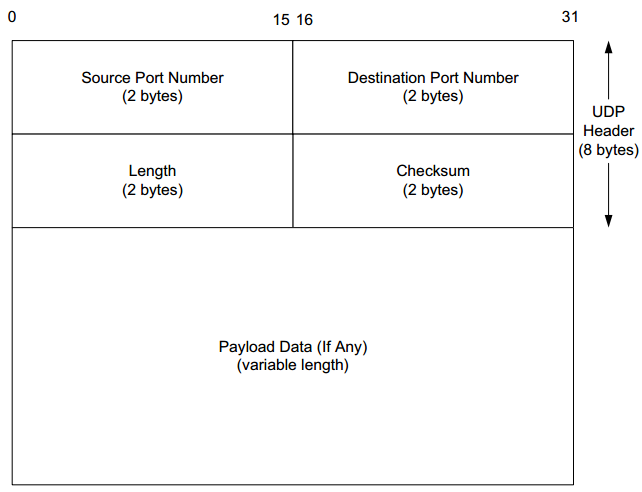
Can we see that in the tcpdump trace above? You betcha. And it is relatively straightforward.
127.0.0.1.59720 > 127.0.0.1.distinct |
Source IP address and port to the left of > and Destination IP address and port to the right of where that packet is being sent to and from. |
[udp sum ok] |
The datagram’s checksum status. |
length 4 |
The packet length (Bytes), not including headers. |
Great. What stands out to me there is checksum let’s take a deeper look at what checksum is and UDP checksum values.
Checksum

Checksum is used to detect errors in the transmitted UDP segment. It is calculated like so:
Sender:
- Treats segment contents, including header fields as a sequence of 16-bit integers.
- Adds together the segment contents (this is the
checksumvalue). - Puts the
checksumvalue into the UDP checksum field.
Receiver:
- Computes checksum of the received segment.
- Checks if computed checksum equals checksum field value:
..if they match
1, ..if they don’t0.
In tcpdump a UDP checksum match will be shown as [udp sum ok], and a non match as [bad udp cksum 0x224d -> 0x2604!] with the differing bytes shown in the checksum field.
N.B.
If a checksum error is detected in a UDP sgment the packet will be dropped (discarded) by the receiver.
Analyse UDP over time with wireshark
save output to file
Let’s save the output of tcpdump to a file… no need to redirect to stdout, there’s a flag for it:
tcpdump -c 20 -n -B port 53 -w udp_port_53_log
A capture packet file has now been created:
[root@rhel-8-1 ~]# file udp_port_53_log
udp_port_53_log: tcpdump capture file (little-endian) - version 2.4 (Ethernet, capture length 262144)
To analyse this file, wireshark can be used (reads pcap pcapng files).

Thanks. RF C791, RFC 6864, A beginner’s guide to network troubleshooting in Linux, Verifying which ports are listening and other articles were useful to write this. This was written by Nick Otter.