How To Monitor Page Cache
Written by Nick Otter.
Contents
- Introduction
- What is Page Cache
- Some ways to monitor Page Cache in memory
- Some ways to monitor Page Cache used by files
- Some ways to monitor Page Cache performance
- Some ways to tune Page Cache
Introduction
After reading Brendan Gregg’s Linux Page Cache Hit Ratio, I decided to go down a rabbit hole, try cachestat and look for different tools that could be used to monitor or debug Linux Page Cache. This article will not necessarily be a deep dive into Page Cache itself, more an overview of useful tools available to manage Page Cache on servers.
Requirements
| Updated | 04/2020 |
| Linux | Kernel 5.4 RHEL 8 4.18 |
What is Page Cache
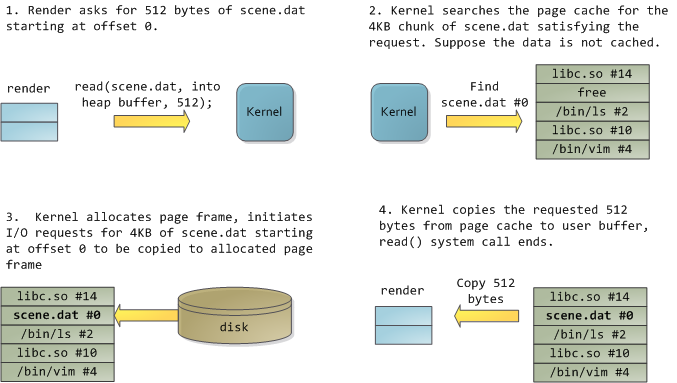
To begin, let’s actually talk about what Page Cache is. Simply, it’s memory held after reading files. All regular file I/O happens through the Page Cache. The kernel prefers to keep unused Page Cache assuming files will be read again in the near future, hence avoiding performance impact on Disk I/O - read more.
Cache types
- Page
caches pages of files to optimise disk I/O. - Buffer
caches disk blocks to optimise block I/O. - Slab
cache for frequently used objects in the Linux Kernel including dentries and inodes.
N.B. The Page Cache and the Buffer Cache were separate prior to Linux Kernel 2.4 , but now the Buffer Cache simply points into the Page Cache - read more . The Buffer essentially stores metadata of the Page Cache. The Kernel does not have access to the Page Cache, but reads from the Buffer.
Source: manybutfinite.com
Some ways to to monitor Page Cache in memory
/proc/meminfo
File that reports statistics about memory usage, man page.
Contents of /proc/meminfo:
| Parameter | Description |
| Buffers | Size of memory used as Buffer Cache in kB. |
| Cached | Size of memory used as Page Cache in kB. |
| SwapCached | Size of Swap memory used as cache in kB. |
[root@rhel-8-1 ~]# grep -i 'buffer\|cache' /proc/meminfo
Buffers:            3384 kB
Cached:          2049840 kB
SwapCached:            0 kB
Changes to /proc/meminfo after writing 100MB of data to a new file:
2c2
< Cached:          2049764 kB
---
> Cached:          2147564 kB
Free
Reads /proc/meminfo with pretty display, man page.
Output of free:
| Column | Description |
| Buffers | Size of memory used as Buffer Cache in kB. |
| Cache | Size of memory used as Page and Slab Cache in kB. |
[root@rhel-8-1 ~]# free --kilo --wide
              total        used        free      shared     buffers       cache   available
Mem:       10430230     1803927     5910695       41590        3465     2712141     8264724
Swap:        999288           0      999288
Output of free compared to /proc/meminfo:
[root@rhel-8-1 ~]# free --kilo --wide
              total        used        free      shared     buffers       cache   available
Mem:       10430230     1803927     5910695       41590        3465     2712141     8264724
Swap:        999288           0      999288

[root@rhel-8-1 ~]# grep -i 'buffer\|cache' /proc/meminfo
Buffers:            3384 kB
Cached:          2146156 kB
SwapCached:            0 kB
Vmstat
Reads /proc/meminfo with pretty display, man page.
Output of vmstat:
| Column | Description |
| Buff | Size of memory used as Buffer Cache in kB. |
| Cache | Size of memory used as Page and Slab Cache in kB. |
[root@rhel-8-1 ~]# vmstat
procs -----------memory---------- ---swap-- -----io---- -system-- ------cpu-----
 r  b   swpd   free   buff  cache   si   so    bi    bo   in   cs us sy id wa st
 2  0      0 5762168   3384 2652148    0    0    21    27   48  122  0  0 99  0  0
Some ways to monitor Page Cache used by files
Pcstat
Get Page Cache statistics for files, github.
Output of pcstat:
| Column | Description |
| Name | Name of file analysed. |
| Size (bytes) | Size of file analysed. |
| Pages | Pages of data for file. |
| Cached | Pages of data for file written to a block device. |
| Percent | Percent of Pages of data for file that have been written to a block device. |
[root@rhel-8-1 ~]# pcstat /usr/lib/locale/locale-archive
+--------------------------------+----------------+------------+-----------+---------+
| Name                           | Size (bytes)   | Pages      | Cached    | Percent |
|--------------------------------+----------------+------------+-----------+---------|
| /usr/lib/locale/locale-archive | 217796096      | 53173      | 286       | 000.538 |
+--------------------------------+----------------+------------+-----------+---------+
Viewing change in Page Cache using pcstat after writing 100MB of data to file:
  4c4
  +-------+----------------+------------+-----------+---------+
  | Name  | Size (bytes)   | Pages      | Cached    | Percent |
< | foo   | 4              | 1          | 0         | 000.000 |
---
> | foo   | 100000000      | 24415      | 24415     | 100.000 |
Vmtouch
Analyse Page Cache for files and directories, github.
Output of vmtouch:
| Parameter | Description |
| Files | Number of files analysed. |
| Directories | Number of directories analysed. |
| Resident Pages | Pages/Cached. |
| Elapsed | Time to execute. |
Output of vmtouch on 100MB file:
[root@rhel-8-1 ~]# vmtouch foo
           Files: 1
     Directories: 0
  Resident Pages: 24415/24415  95M/95M  100%
         Elapsed: 0.005546 seconds
Output of vmtouch on directory /usr/lib:
[root@rhel-8-1 ~]# vmtouch /usr/lib 2>/dev/null
           Files: 21194
     Directories: 3600
  Resident Pages: 133927/382366  523M/1G  35%
         Elapsed: 0.32407 seconds
I also looked at fincore - it’s not being currently maintained and pcstat is a good equivalent.
Some ways to monitor Page Cache performance
Cachestat
Reads /proc/meminfo and calculates Page Cache hit/miss statistics, github.
Output of Cachestat:
| Column | Description |
| Time | Current time. |
| Hits | Successful reads (of Page Cache). |
| Misses | Unsuccessful reads / insertions into cache. |
| Dirties | Dirty pages waiting to be written. |
| Ratio | % Unsuccessful vs. Successful reads. |
| Buffers_MB | Buffer Cache size in MB. |
| Cache_MB | Page Cache size in MB. |
[root@rhel-8-1 ~]# ./cachestat -t
Counting cache functions... Output every 1 seconds.
TIME         HITS   MISSES  DIRTIES    RATIO   BUFFERS_MB   CACHE_MB
12:48:12     1554        0        0   100.0%            2       1212
Output of cachestat after dropping Page Cache and running chcksm to rebuild cache on a 100MB file:
[root@rhel-8-1 ~]# cachestat -t
Counting cache functions... Output every 1 seconds.
TIME         HITS   MISSES  DIRTIES    RATIO   BUFFERS_MB   CACHE_MB
20:31:06     1570        0        0   100.0%            0        852
20:31:07     1561        0        0   100.0%            0        852
20:31:08     1572        0        0   100.0%            0        852
20:31:09     3048     1102        0    73.4%            0        438
20:31:10     1550        5        0    99.7%            0        442
20:31:11     1149        0        0   100.0%            0        442
20:31:38     1536        0        0   100.0%            0        442
20:31:39     -150     1868        0    -8.7%            0        452
20:31:40     6767    22559        0    23.1%            0        540
20:31:41     1574        0        0   100.0%            0        540
Some ways to tune Page Cache
Dropping Page Cache
/proc/sys/vm/drop_caches
Execute this command to drop Page Cache, man page:
$ echo 1 > /proc/sys/vm/drop_caches
Results after dropping Page Cache:
[root@rhel-8-1 ~]# cachestat -t
Counting cache functions... Output every 1 seconds.
TIME         HITS   MISSES  DIRTIES    RATIO   BUFFERS_MB   CACHE_MB
10:04:42     3887     1095        0    78.0%            0        434
[root@rhel-8-1 ~]# pcstat foo
+-------+----------------+------------+-----------+---------+
| Name  | Size (bytes)   | Pages      | Cached    | Percent |
|-------+----------------+------------+-----------+---------|
| foo   | 100000000      | 24415      | 0         | 000.000 |
+-------+----------------+------------+-----------+---------+
[root@rhel-8-1 ~]# vmtouch /usr/lib 2>/dev/null
           Files: 21194
     Directories: 3600
  Resident Pages: 1590/382366  6M/1G  0.416%
         Elapsed: 1.6036 seconds
Building Page Cache
cksum
Reads data and checks for corruption, by reading all Pages of that file are then cached, man page.
[root@rhel-8-1 ~]# pcstat foo
+-------+----------------+------------+-----------+---------+
| Name  | Size (bytes)   | Pages      | Cached    | Percent |
|-------+----------------+------------+-----------+---------|
| foo   | 100000000      | 24415      | 0         | 000.000 |
+-------+----------------+------------+-----------+---------+
[root@rhel-8-1 ~]# cksum foo && pcstat foo
+-------+----------------+------------+-----------+---------+
| Name  | Size (bytes)   | Pages      | Cached    | Percent |
|-------+----------------+------------+-----------+---------|
| foo   | 100000000      | 24415      | 24415     | 000.000 |
+-------+----------------+------------+-----------+---------+
Controlling Page Cache thresholds
/proc/sys/vm/vfs_cache_pressure
Control tendency of the kernel to reclaim memory which is used for Page Cache, no man page available.
Default value of /proc/sys/vm/vfs_cache_pressure:
[root@rhel-8-1 ~]# cat /proc/sys/vm/vfs_cache_pressure
100
Change pressure:
echo n >>/proc/sys/vm/vfs_cache_pressure.
Thanks. Articles like Buffer Cache and Page Cache, Buffer and Cache Columns In /proc/meminfo, Linux Kernel Development, Linux-fincore To Check Linux Page Cache Usage, File System Cache Analysis, Understanding The Linux Kernel, Page Cache, The Affair were helpful to write this. This was written by Nick Otter.